

- - MicrotracBEL
- - Grabner
- - Iludest
- - AD Systems
- - Porometer
- - Fueltech
- - Orbis
- - Hydramotion
- - Gibertini
- - Mercury Instrument
- - Paragon Scientific
- - Rubolab
- - Normalab
- - Green Lab
- - Tanaka
- - Forza International
- - Carbolite Gero
- - Adscientis

- - 흡착 (adsorption)
- - 석유화학 (petrochemical)
- - 열중량분석 (TG)
- - 멤브레인 (membrane)
- - 증류 (distillation)
- - 점도 (viscosity)
- - 와인학 (oenology)
- - 실험실 (lab instrument)
- - 촉매특성평가 (TPD/TPR)
- - 연료전지성능평가(Fuel cell)
- - 반응기(Micro-Reactor)
- - 가스분석기(Mass spectrometer)
- - 수은분석 (mercury)
- - 표준시약 (CRM, SRM)
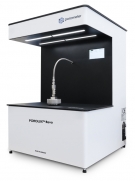 |
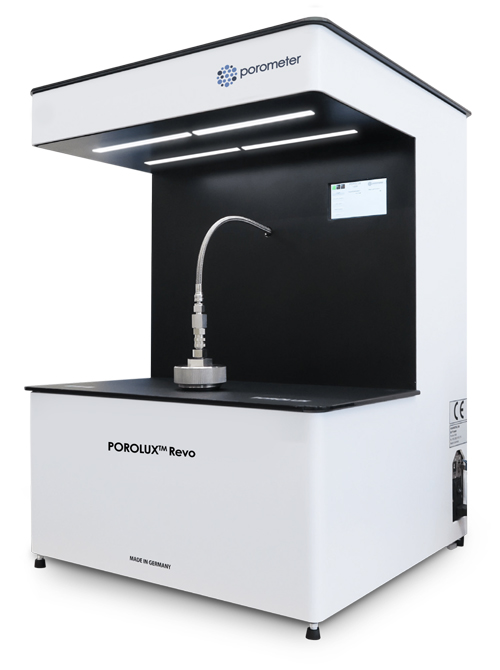
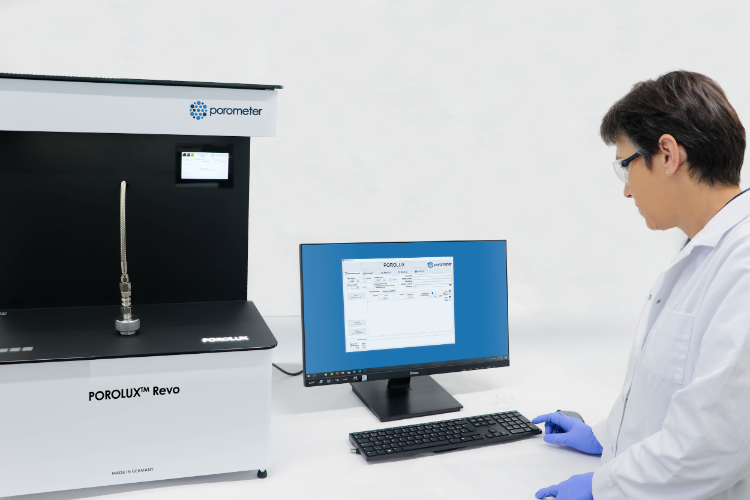
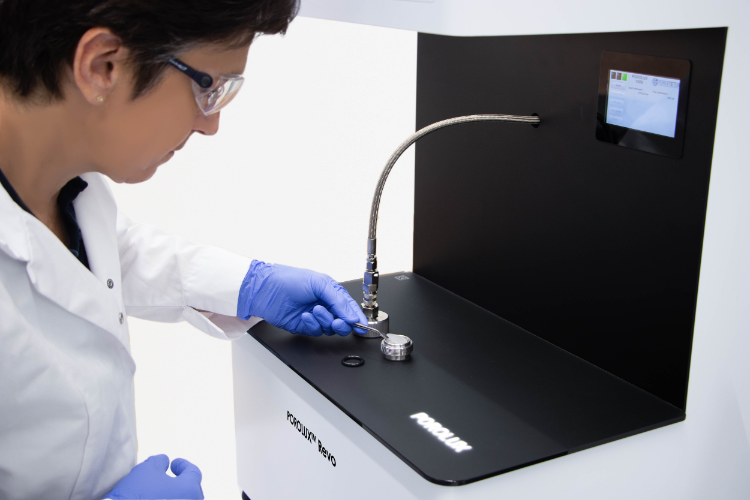
POROLUX™ Revo |
Capillary flow porometer for R&D |
|
 |
|
| Features | |
|
2022년 12월 부로 Porometer사 장비 모델명이 아래와 같이 변경되었으니 참고 부탁드립니다.
변경 전 변경 후 POROLUX™ 50 POROLUX™ BP POROLUX™ 100 POROLUX™ Cito L POROLUX™ 200 POROLUX™ Cito M POROLUX™ 500 POROLUX™ Cito POROLUX™ 1000 POROLUX™ Revo POROLIQ™ 1000 AQ POROLIQ™ AQ POROLIQ™ 1000 ML POROLIQ™ ML
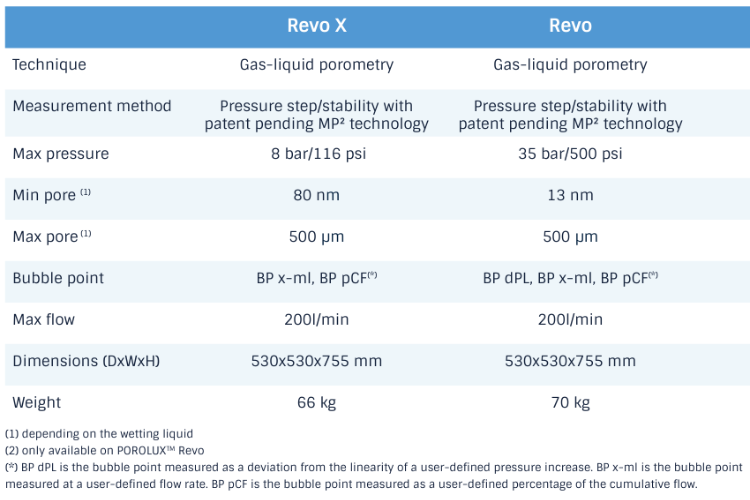
POROLUX™ Revo- POROLUX™ 1000 후속 모델 - 최소 13 nm까지 멤브레인, 중공사막등의 기공크기 측정 - 기공크기 측정범위: 13 nm to 500 nm - 35 bar까지 가압 - 특허 출원중인 MP2 (Multistage Pressure Process) 기술로 정밀한 압력 컨트롤 - 3가지 bubble point 측정 방식 - 직관적이고 사용하기 쉬운 소프트웨어
POROLUX™ Revo X- 최소 80 nm까지 멤브레인, 중공사막등의 기공크기 측정 - 기공크기 측정범위: 80 nm to 500 nm - 8 bar까지 가압
Specifications
Data
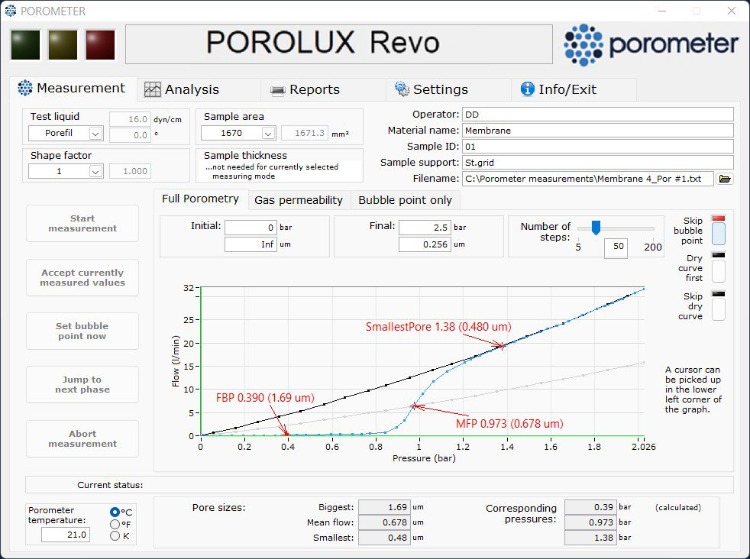
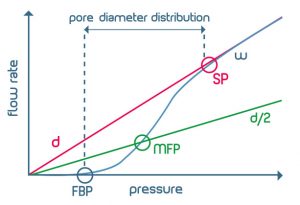
Measuring curves and resulting parameters in CFP (w = wet curve, d = dry curve, d/2 = half-dry curve, FBP = largest pore, MFP = mean flow pore, SP = smallest pore) In a typical CFP test a flow of pressurized gas is applied to the porous sample impregnated with the wetting liquid and the flow of gas through the sample, as the liquid is displaced out of the porous network, is measured. The “wet curve” represents the measured gas flow against the applied pressure. Following the wet curve, the gas flow against the applied pressure on the dry sample (“dry curve”) is also measured. From data from the wet curve, the dry curve and the “half-dry curve” (dividing the flow values of the dry curve by 2) information about the porous network can be obtained.
•Bubble point •Smallest pore size •Mean flow pore diameter •Gas permeability •Cumulative filter flow [SUM]
|
|